Changelog
New updates and improvements to Cartograph.
Enhanced Documentation Structure
The generated documentation now has improved structure and navigation, making it faster for you to find relevant information.
New documentation Structure
Each entity type now has a specific structure, in addition to the existing overview and explanation:
- Function: Inputs, Outputs, Usage Examples, External Usage
- Class: Constructor, Attributes, Methods, Usage Examples, Inheritance, External Usage
- Struct: Fields, Usage Examples, Implementations, External Usage
- Interface: Required Methods, Provided Methods, Usage Examples, Implementers, External Usage
- Type: Fields, Usage Examples, External Usage
- Enum: Variants, Usage Examples, External Usage
Interlinking 🔗
References to other code entities in the documentation are now linked, allowing for seamless navigation between related components.
These enhancements are designed to help you explore your codebase more efficiently and understand connections you might have missed before.
Improvements
- The HTTP route finding precision and recall has been improved
- Typescript Interface and Type are now classified as Type entities. Interface entities are reserved for Rust-like Interface.
- Order file children in file tree and interactive diagram based on their line number in file
- Dragging on an expanded folder will now pan the whole diagram instead of moving the entire folder
- Improved styling for links and inline codeblocks in documentation
Sharable Projects
You can now change your project visibility to public, allowing users outside your organization to view the project’s documentation. Viewers can access your public documentation via a shared link, but they will not be able to make any edits.
Internally, we are using this feature to share our demo projects.
Improvements
- Support
requirestatements as import in Javascript - Change login flow from password to magic link
- Queue requests to LLM proxy to prevent hitting rate limits
HTTP endpoints and calls
You can now find and visualize HTTP endpoints across your entire codebase, helping you understand how your services communicate. This feature goes beyond what IDEs can currently offer by mapping HTTP API connections that cross package and language boundaries.
This new capability helps you:
- Understand indirect dependencies between services
- Catalog your HTTP endpoints across your projects
- Understand where HTTP endpoints are being called from
- Identify unused HTTP endpoints


Common use cases
Refactoring APIs safely Before modifying an endpoint like /api/users, quickly see all frontend components and services that depend on it. This helps prevent breaking changes and identifies which teams to coordinate with.
Debugging API issues When troubleshooting API-related bugs, trace the complete path from frontend component through authentication middleware to the final backend handler - all in one view.
API documentation Use the endpoint view as a living documentation of your API infrastructure. New team members can quickly understand how services interact and where specific functionality is implemented.
Check out this example project with HTTP calls between the frontend and backend:
Rust Support 🦀
You can now use Cartograph on projects written in Rust. Our graph generation engine can parse and visualize Rust modules, functions, structs, traits, and their relationships across your codebase.
Some key features:
- Module-based visualization showing how your Rust code is organized
- Trait implementation tracking
- Dependency mapping between crates and modules
- Function call graphs including trait method calls
You can explore your crate’s architecture from a high level, then drill down into specific modules to see how different components interact.
Check out this example Rust codebase:
Butterfly graphs
Reference documentation now includes butterfly graphs that visualize both incoming references and outgoing dependencies for any code entity. These bidirectional graphs give you an immediate visual understanding of how the entity interacts with the rest of your codebase.

- Docs: Read detailed descriptions and usage information
- Graph: Explore dependencies and references visually
- Source: View the underlying implementation
New Unified Documentation and Graph Interface
We have revamped Cartograph to display the documentation and graph views together, complementing each other. You can easily swap between both of them as you are exploring and understanding the codebase, based on what you want to see at that time.
This video walks through the Cartograph project for FastAPI’s full-stack-fastapi-template repository. The codebase description, system architecture diagram, reference documentation, and interactive graphs of each service are presented as an organized knowledge base.
Organisations, Projects, Services
We’re introducing a three-tier system to help teams organise their codebases.
Organisation
You can now create an organisation and invite your team to it. Your team will be able to see the Projects that you have set up in the dashboard.
Project
A Project is a user-defined grouping of repositories that work with each other. Use Projects to connect multiple relevant repositories from your organisation. Cartograph will analyze them together to understand their relationship and dependencies.
Service
Services represent the independent, deployable components within your repositories. Whether you have a single service per repository or multiple services in a monorepo, Cartograph automatically identifies these services and uses this information to create a comprehensive system view.
How it works
Cartograph automatically analyzes all repositories in your project to:
- Identify individual services
- Generate service-level documentation and interactive diagrams
- Map dependencies between services
- Create project-level documentation and architecture diagrams

AI-generated documentation
You can now generate reference documentation for your codebase on Cartograph. Docs are generated for each file, function and class.
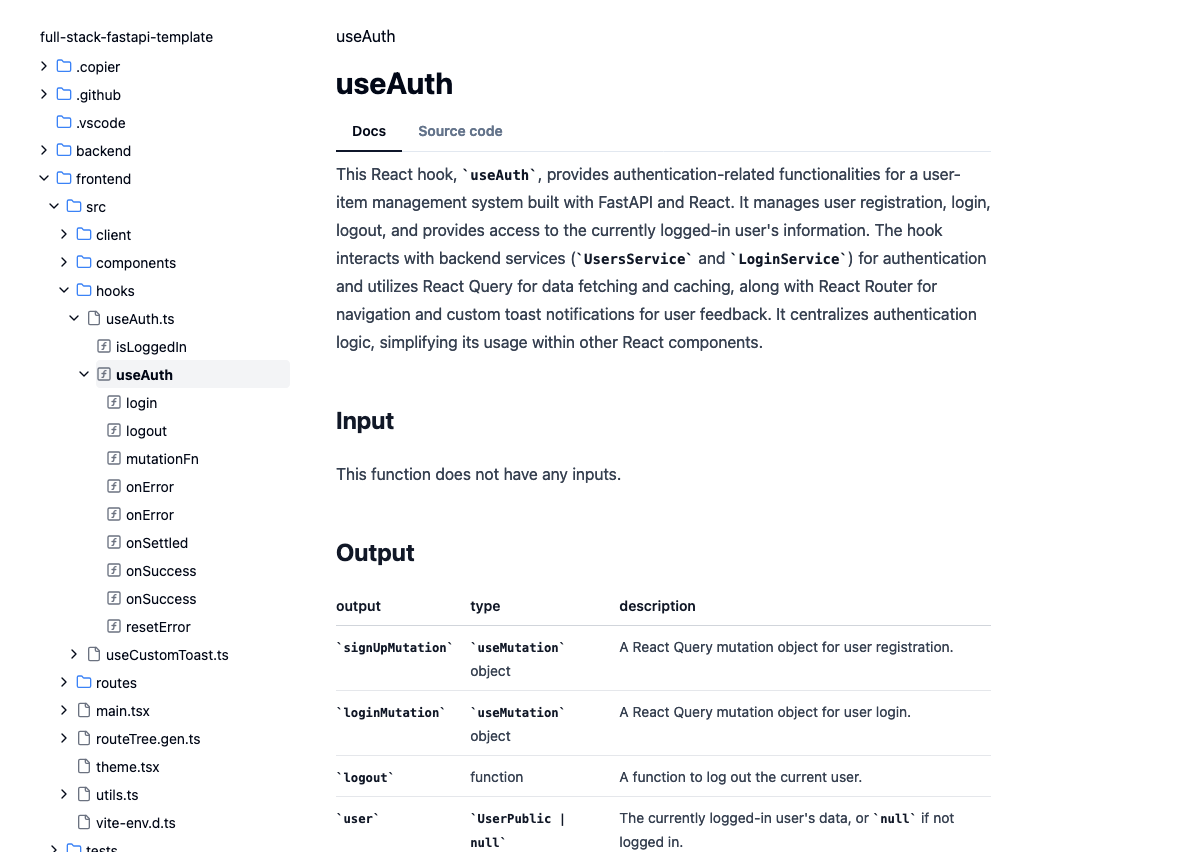
The docs for functions and classes also show where and how they are used across the repository, powered by the context provided by our graph generation.
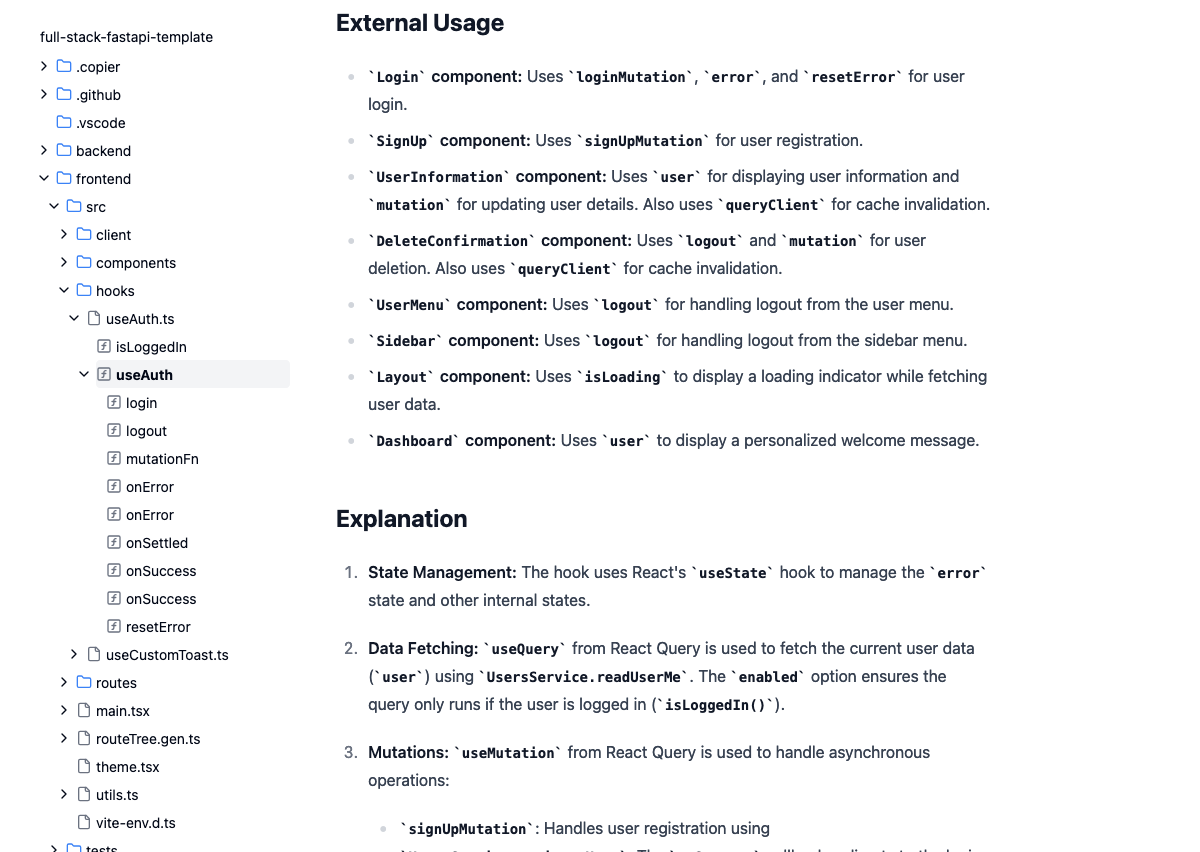
Explore the documentation for these demo repositories:
Faster graph loading and more demo repo graphs
The graph page loads much faster now, with caching of the AI-generated repo summary and graph nodes.
We have also loaded more demo repo graphs for you to explore! Some AI repos:
React and Next.js repos:
You can access all the demo repos on the home page.
JavaScript and TypeScript improvements
You can navigate JavaScript and TypeScript codebases more effectively with improve type visibility and import resolution.
- Import all resolution: import-all syntax (e.g
import * as name from "myModule";) now have their imports resolved correctly, allowing you to have a better understanding of where the links come from. - Types: Interfaces and Enums now appear in the graph.
- Variables: Variables which define a callable entity (i.e end up being called) are now also being parsed when resolving calls, allowing you visualize the calls better.
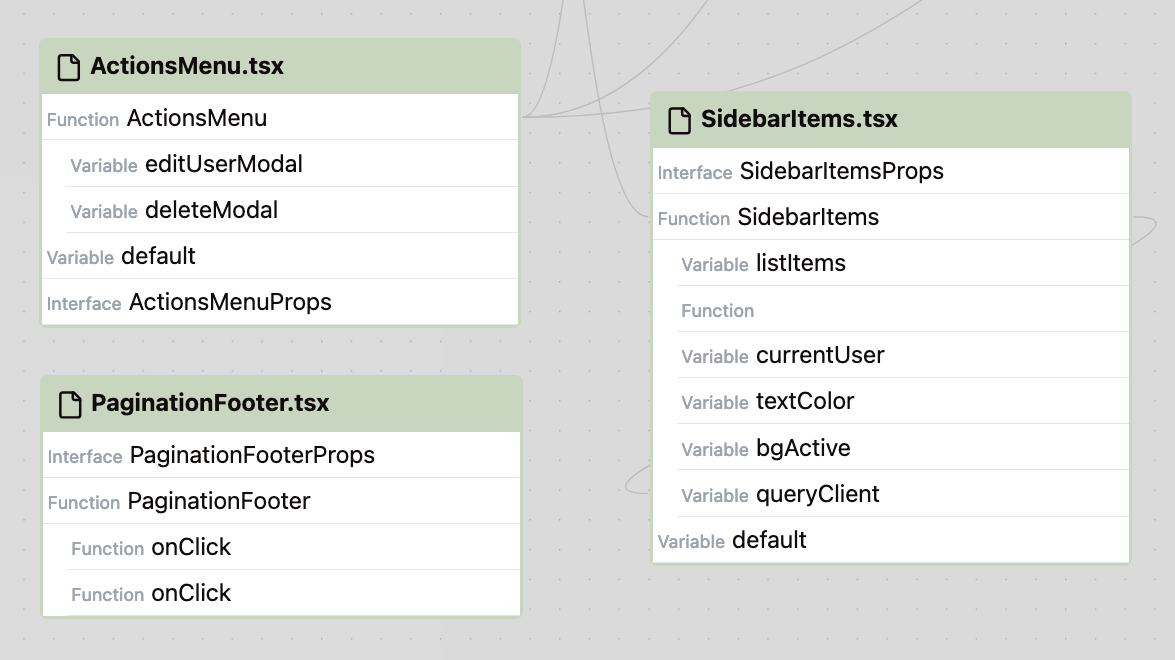
Folder-based code visualization
You can now visualize your codebase structure more intuitively, with files grouped by folders. Expand and collapse folder nodes to dive into specific areas, or get a high-level overview of your project architecture.
The graph starts from an overview of the repo, and the main modules within the codebase.
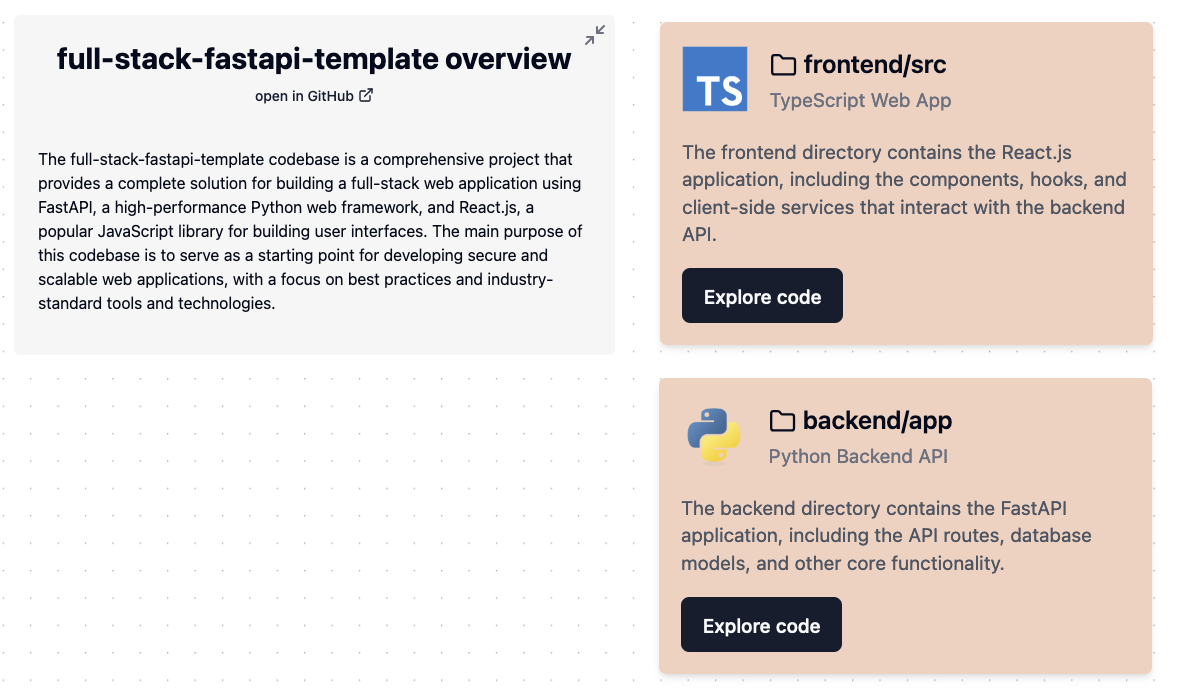
Click to explore the code for any module. You can then expand and collapse folders to explore the module’s code.
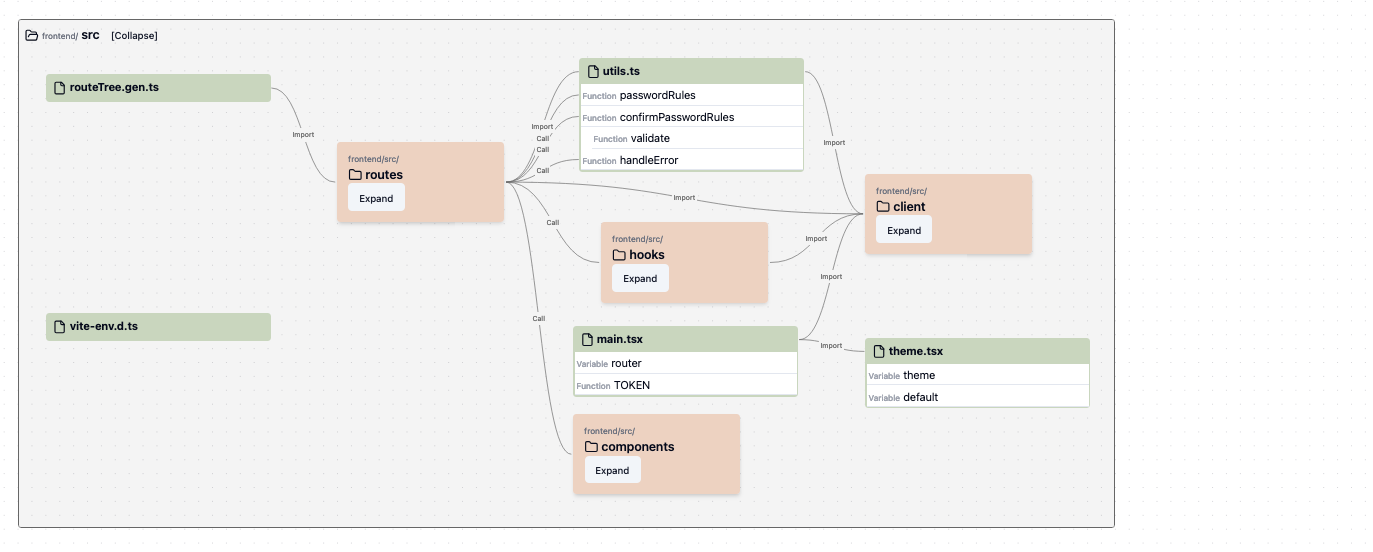
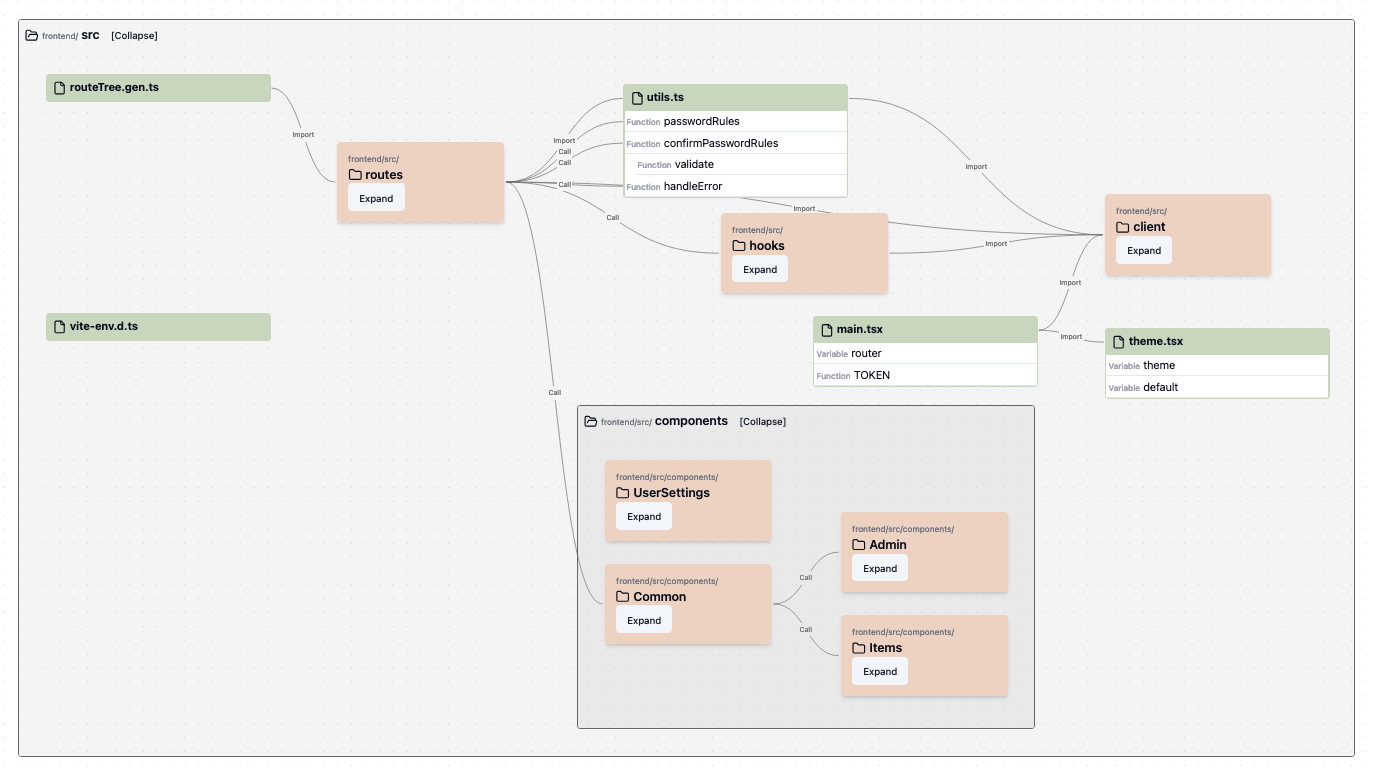
When collapsed, folder nodes display connections to other files and folders. This hierarchical view makes it easier to grasp the structure of your codebase and understand the dependencies between each part.
JavaScript and TypeScript support
You can now use Cartograph with JavaScript files. We have added TypeScript as well (no types support yet, we are still figuring that one out).
You can also use it with React .jsx or .tsx files. If a function or class uses a React component, that will create a Call link to the source of the React component.
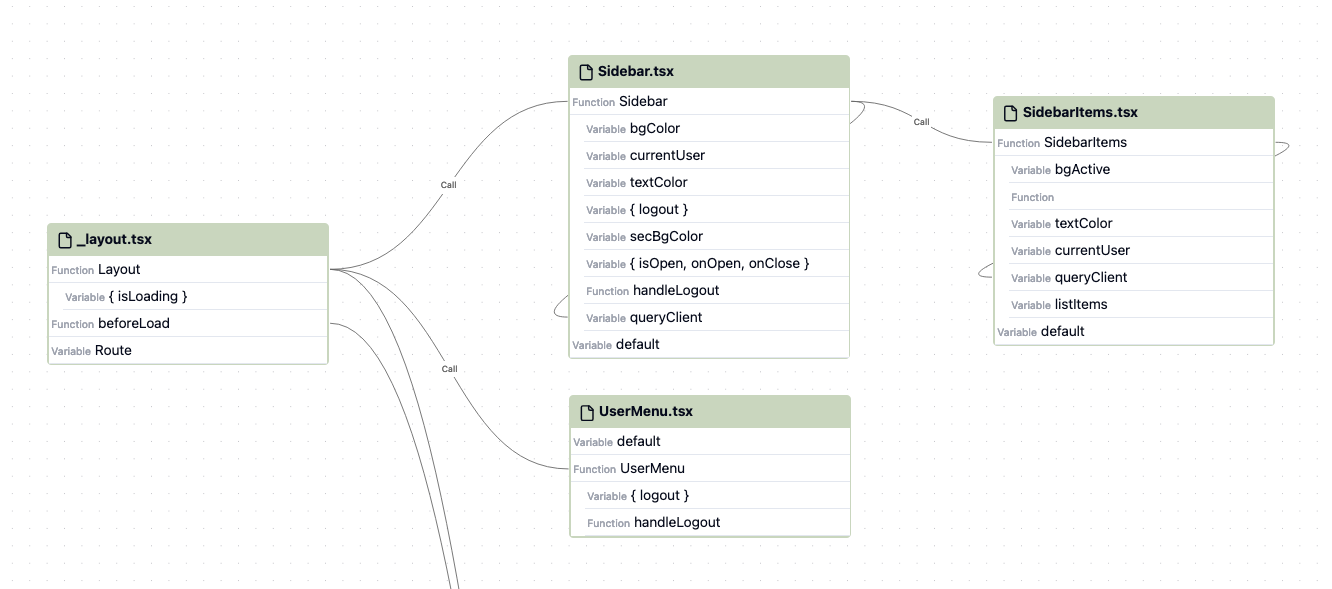
See it working on some of the example repositories:
Faster graph generation
It’s been a while since the last update - we’ve been busy rewriting our codebase parsing and graph generation logic from scratch using Rust 🦀. The original parser was writenin Python and used Python’s importlib standard library, which was slow and couldn’t be extended for other languages. We have refactored the parser to not depend on importlib but rather read the paths and figure out the imports.
This has cut the graph generation time by 100x-200x for most codebases while still the same (or better) outputs, compared to our original Python parser.
Some internal benchmarks:
| Repo | 🐍 With Python parser | 🦀 With new Rust parser |
|---|---|---|
| aider | 1min 3s | 0.3s |
| Verba | 1min 2s | 0.15s |
| next-fast-turbo | 29s | 0.07s |
Note: the performance gain is not only from changing the language from Python to Rust, but also from significant improvements to the algorithm to find imports across files.
The accuracy of the import links has improved as well, with the new algorithm allowing us to link more difficult Python import cases, such as when importing from __init__.py files.
This will allow us to iterate with our visualization much faster, as well as bringing you more codebases and languages very soon. We’re working on JavaScript/TypeScript support next! And we’ll be enabling you to generate graphs for repos on-demand soon.
First release
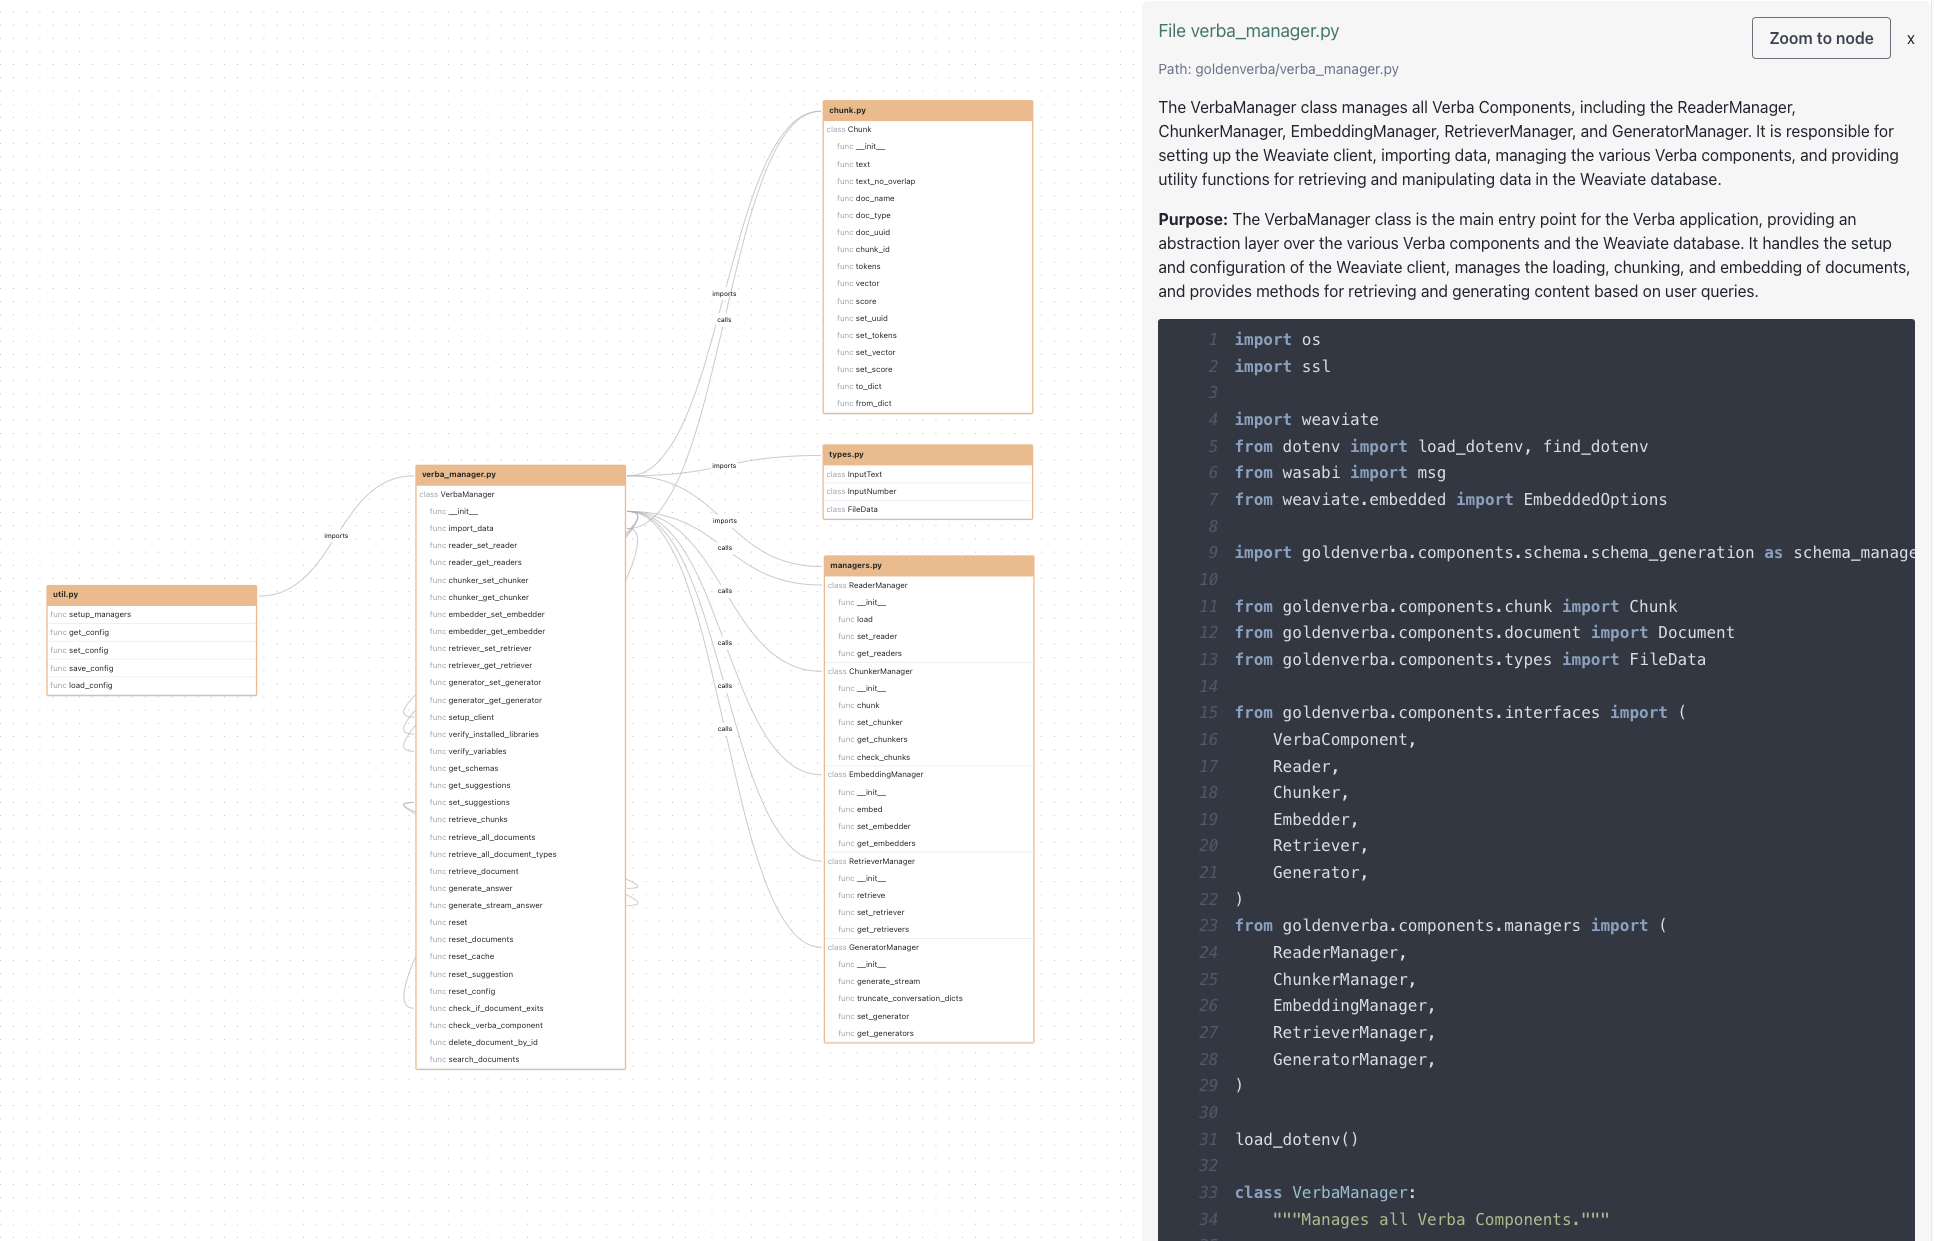
We have released the first version of our beta product, a tool to help developers understand codebases effectively. It takes a GitHub repository url as an input, and produces an overview of the codebase together with the main top-level modules. You can also dive into a module to visualize its contents and the connections between them. Currently, we only support visualizing of Python code.
We extract the following items from the code:
- Files
- Classes
- Functions
- Imports
And the following links between these items:
- Function call
- Class instantiation
- Class inheritance
- Import source
Currently parsing the nodes and links is slow, so message us if you are interested to visualize a particular codebase, we will add it and inform you.
Built something this weekend
This weekend, we built an early prototype of our vision for how developers can understand codebases better. Understanding a codebase is vital to be able to contribute effectively to it, but it is difficult and time consuming. We spend much more time reading code than writing code. Yet, we don’t have good tools available to understand code beyond the features of our IDE or asking ChatGPT to explain the code to us. We want to change that.
So we are building Cartograph.